Coordination on a two-year hospital build
Every screen below is the product, not a mockup. They were captured against a 120-bed acute care project running eight phases from programming to first patient day.
This is a sample project used for demonstration. The partner companies, the people and the contact details in these screenshots are fictional, and no real customer data is shown.
Where the schedule actually hurts
The coordination dashboard opens on a Gantt two weeks back and four weeks ahead, so the first thing anyone sees is what is due now rather than the whole programme at once. Every phase of the job, from programming through to first patient day, sits on one plan.
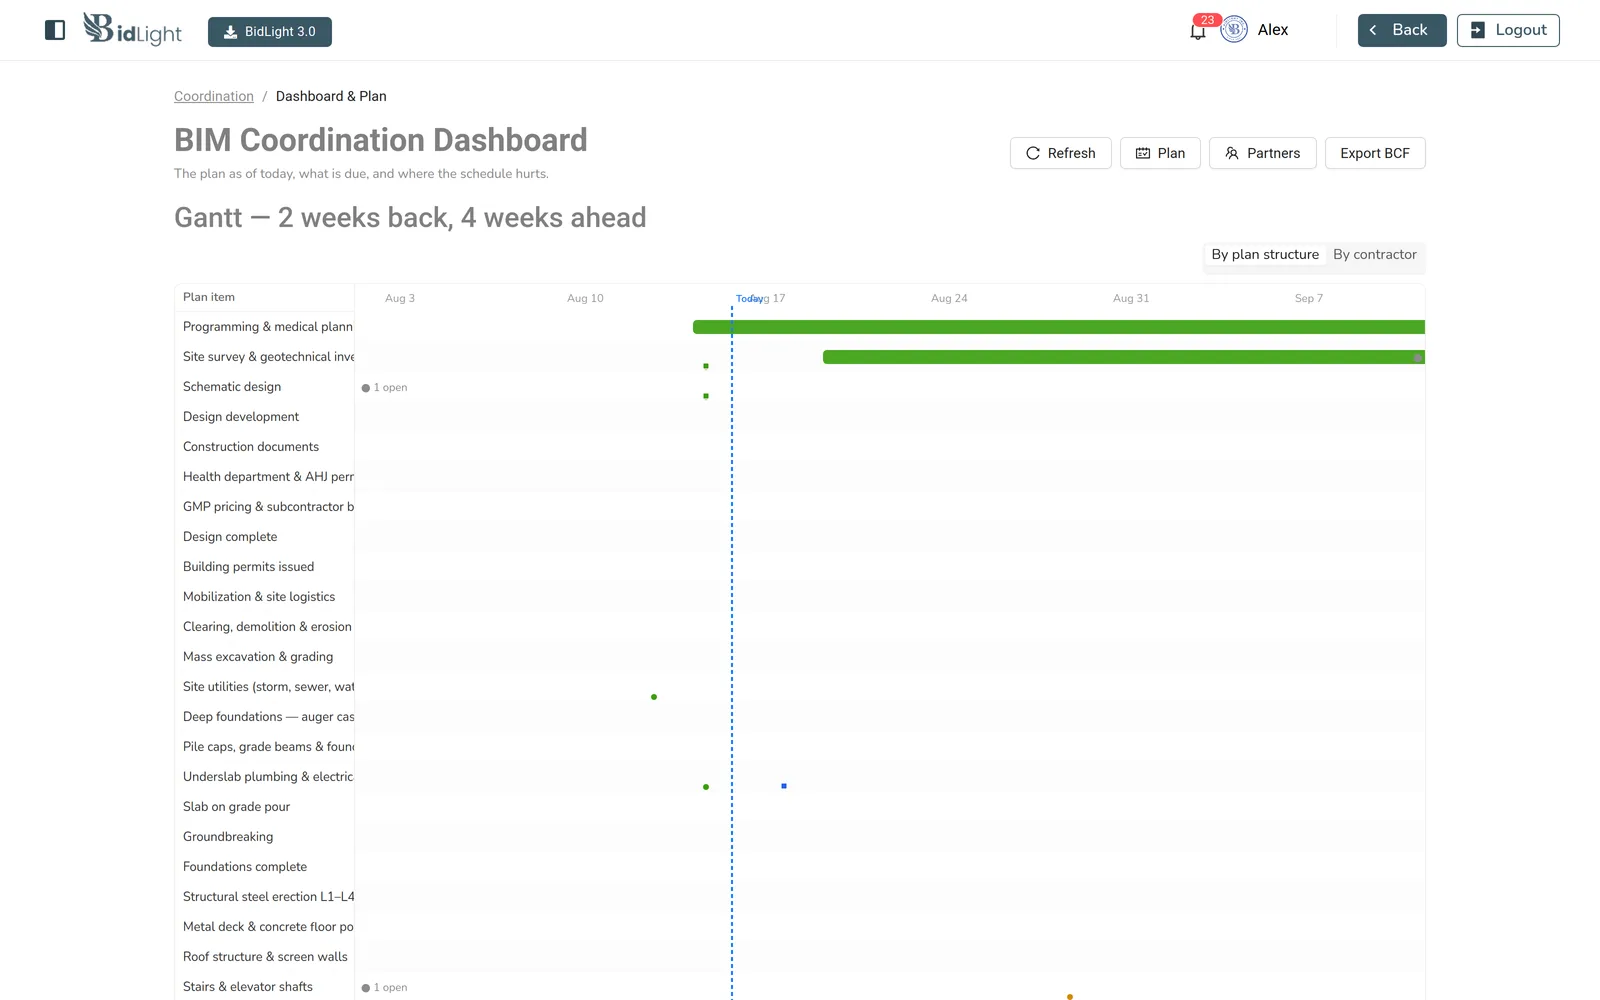
Every task carries its own issue count
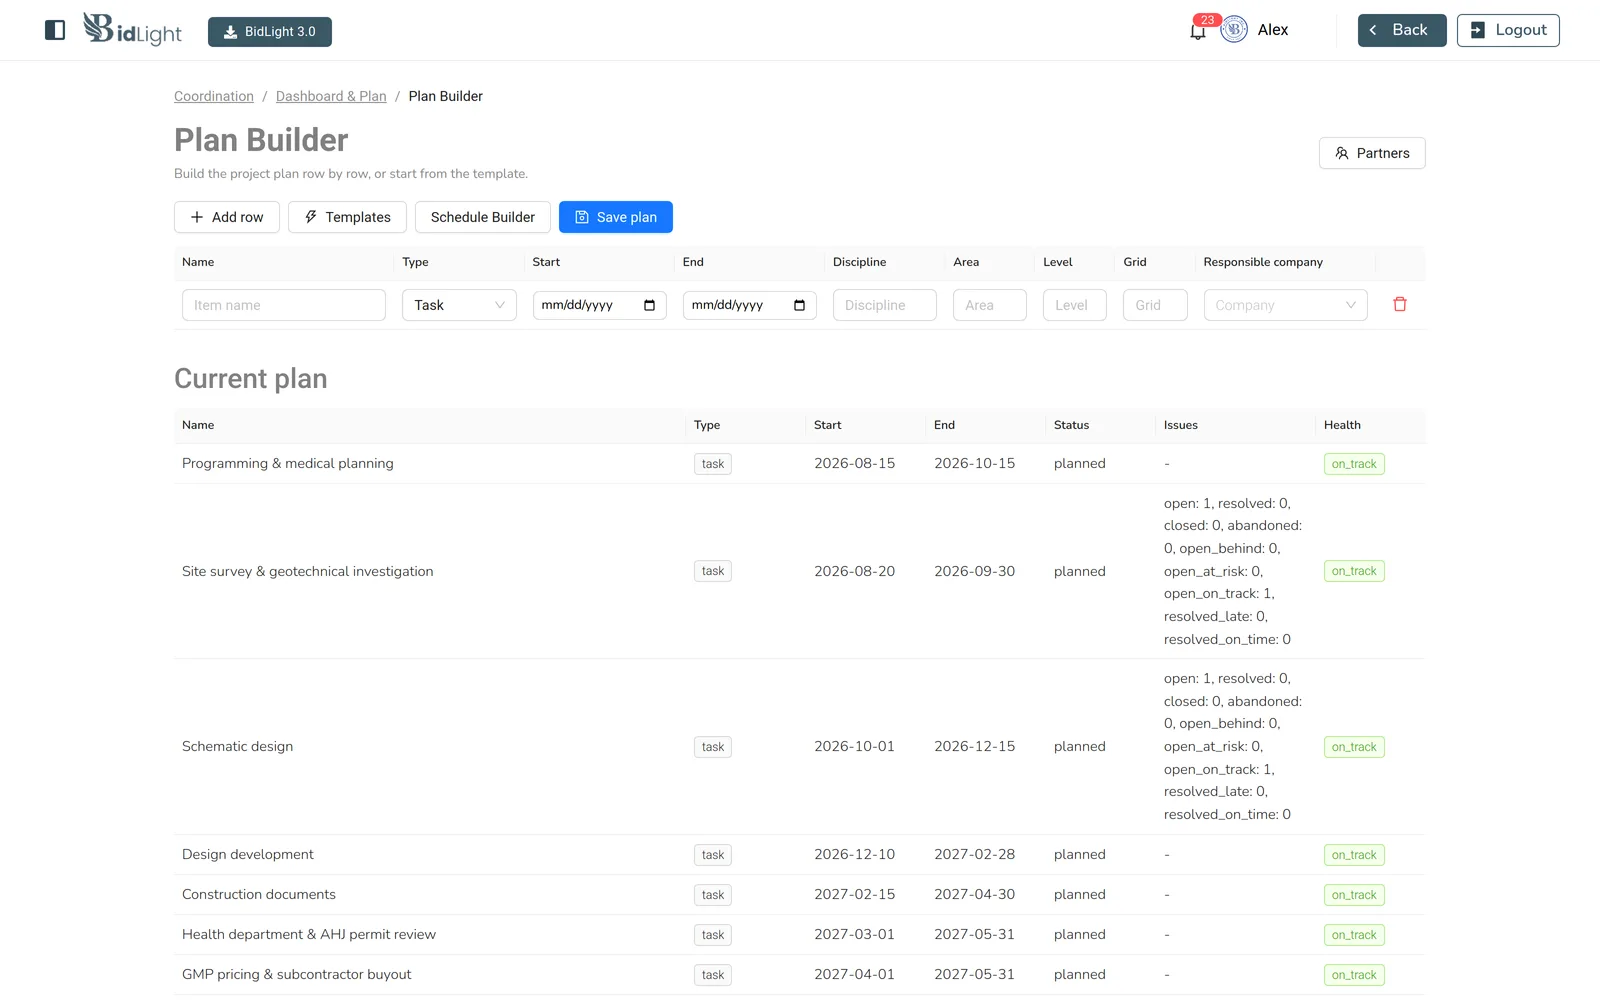
The plan is not a separate document that goes stale. Each row reports open, resolved, closed and abandoned issues, how many are behind, at risk or on track, and whether the work was resolved late or on time — so a task is green because the evidence says so.
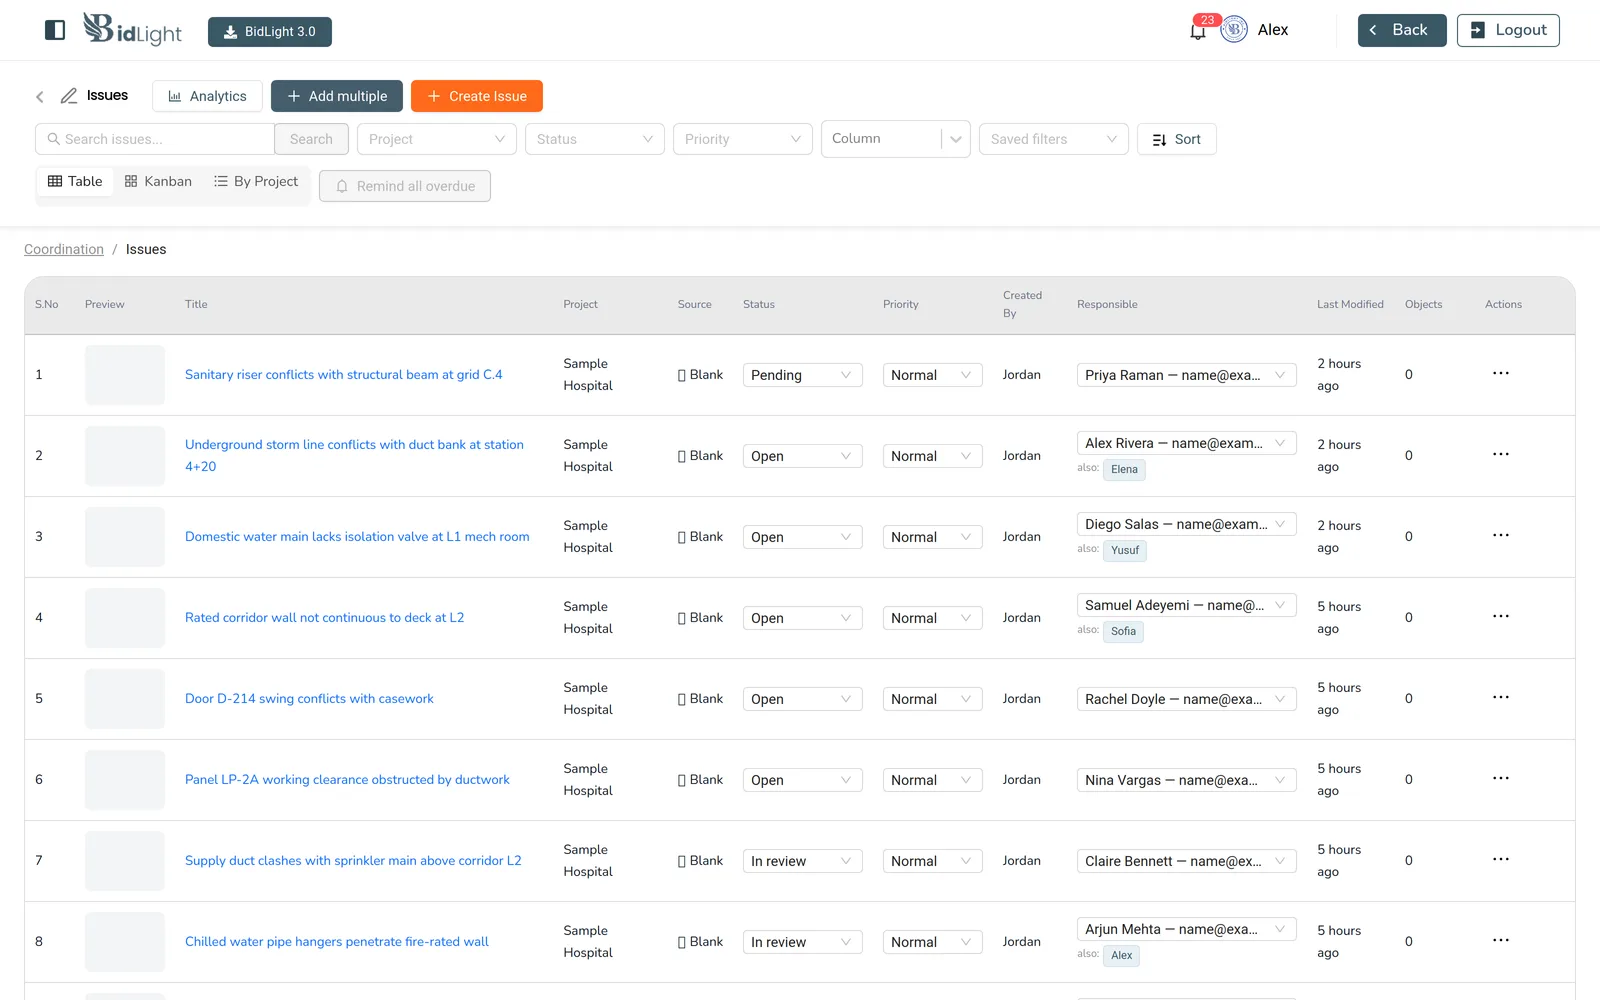
Pinned to the element, owned by a person
A sanitary riser conflicting with a structural beam at grid C.4 is not a line in a meeting minute. It is an issue against the element, with a status, a priority, an owner and a second name copied in, and it stays there until somebody resolves it.
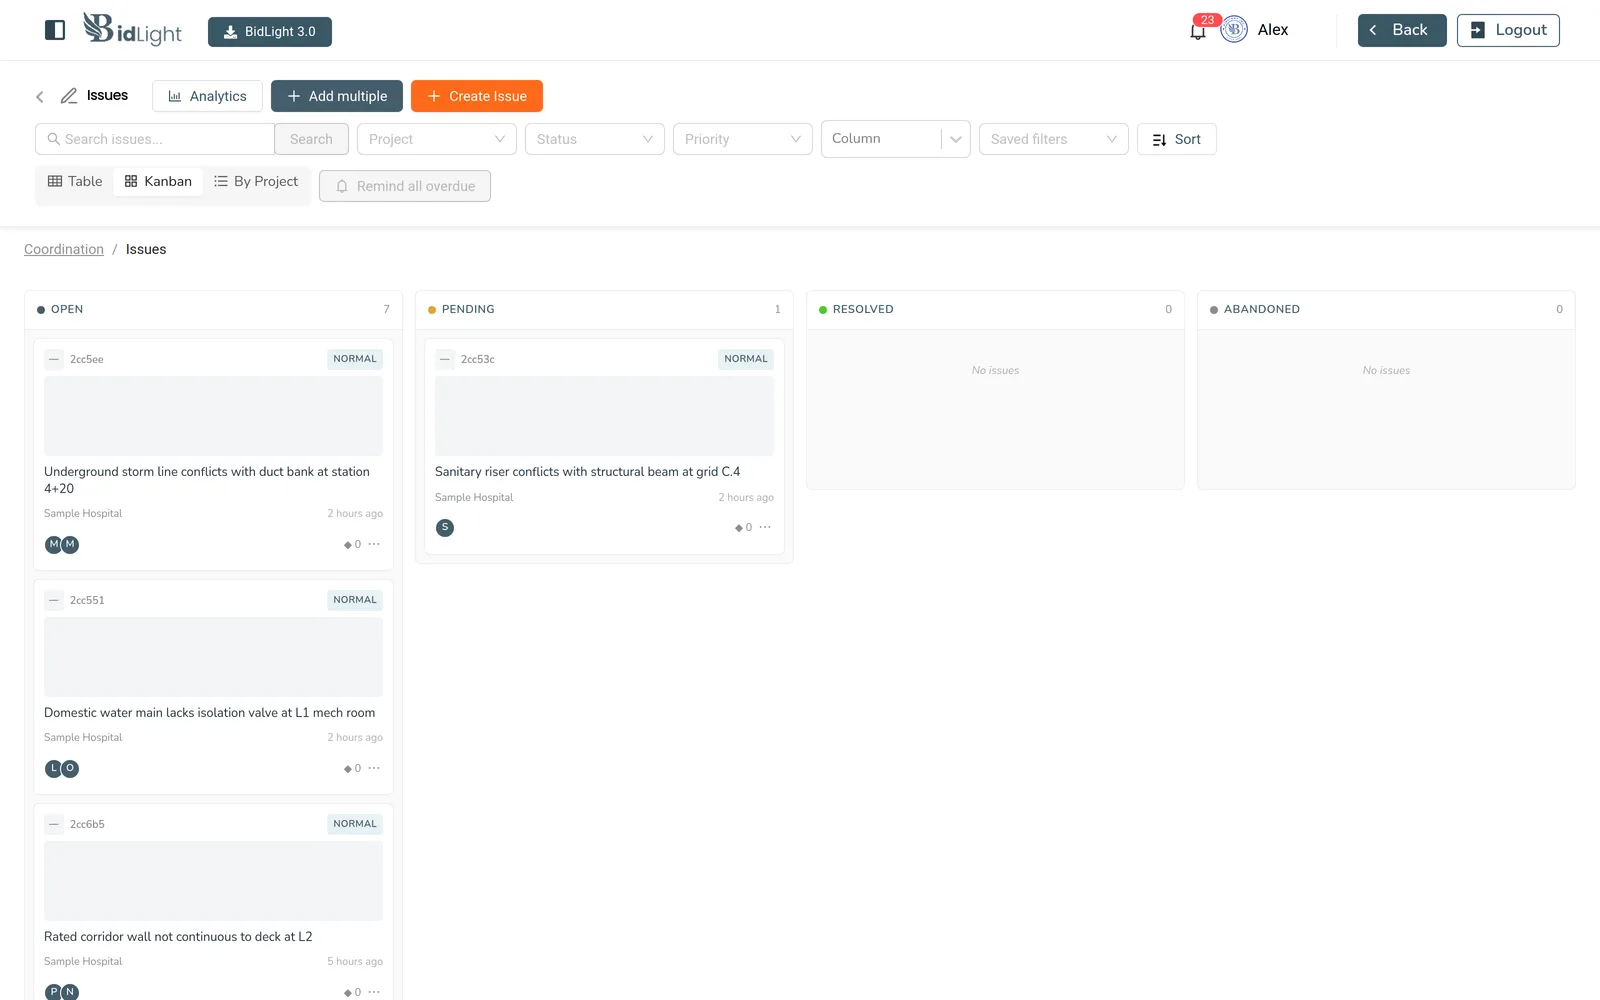
Board view when you are asking who is stuck
Table view answers "what is open". Board view answers "where is it jammed". Same records, no re-entry, and a filter set you can save and come back to.
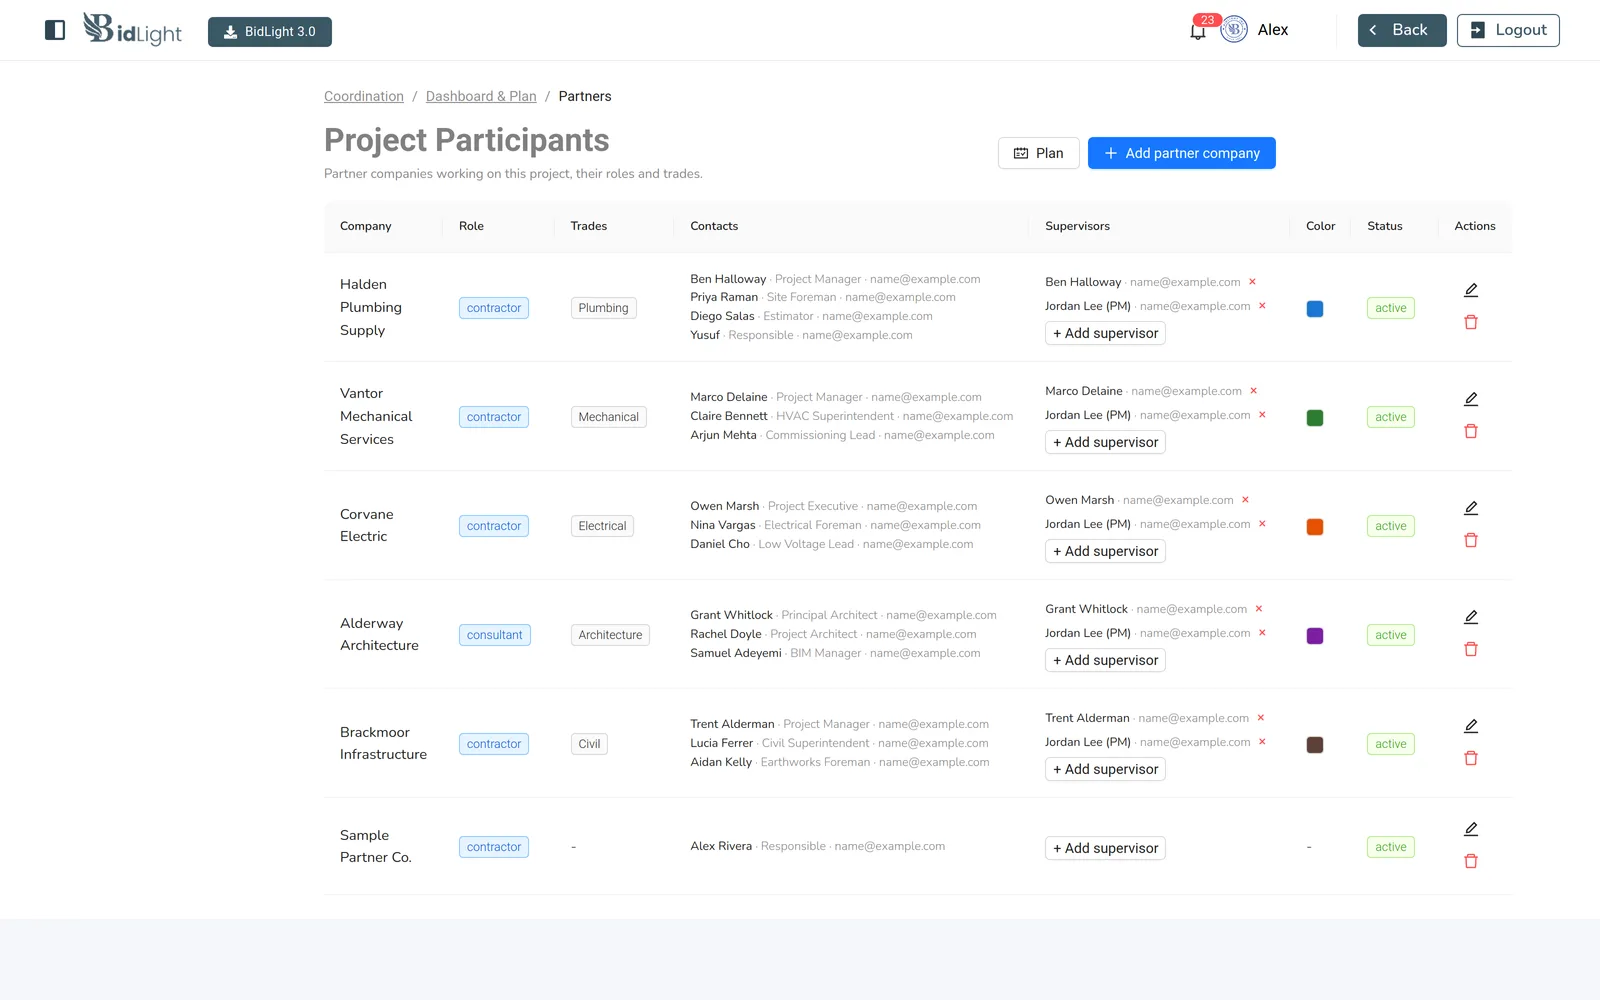
Who is on the job, and what they own
Partner companies, their trade, their contacts and the supervisor accountable for each one. When an issue is assigned by trade, this is the list it is assigned from.
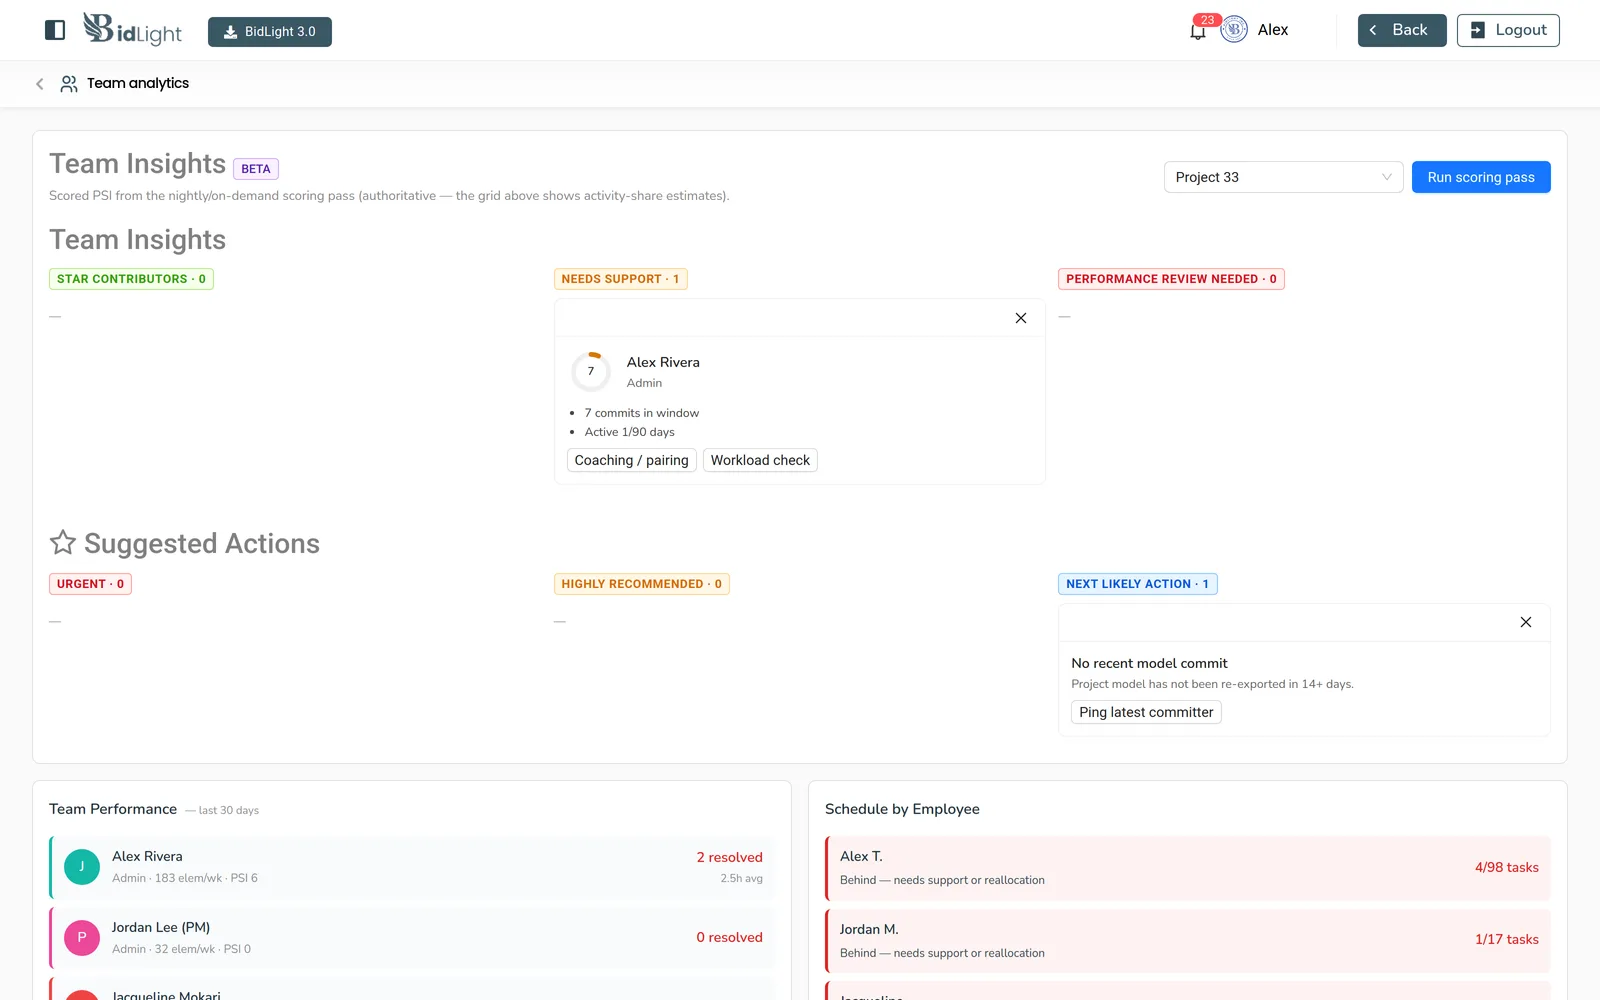
Who is ahead, and who needs help now
Contribution tracking, resolution rates and a Problem Solver Index per person, with the flagging done against the schedule rather than a gut feel. You find out somebody is behind while there is still time to move work, not at the post-mortem.
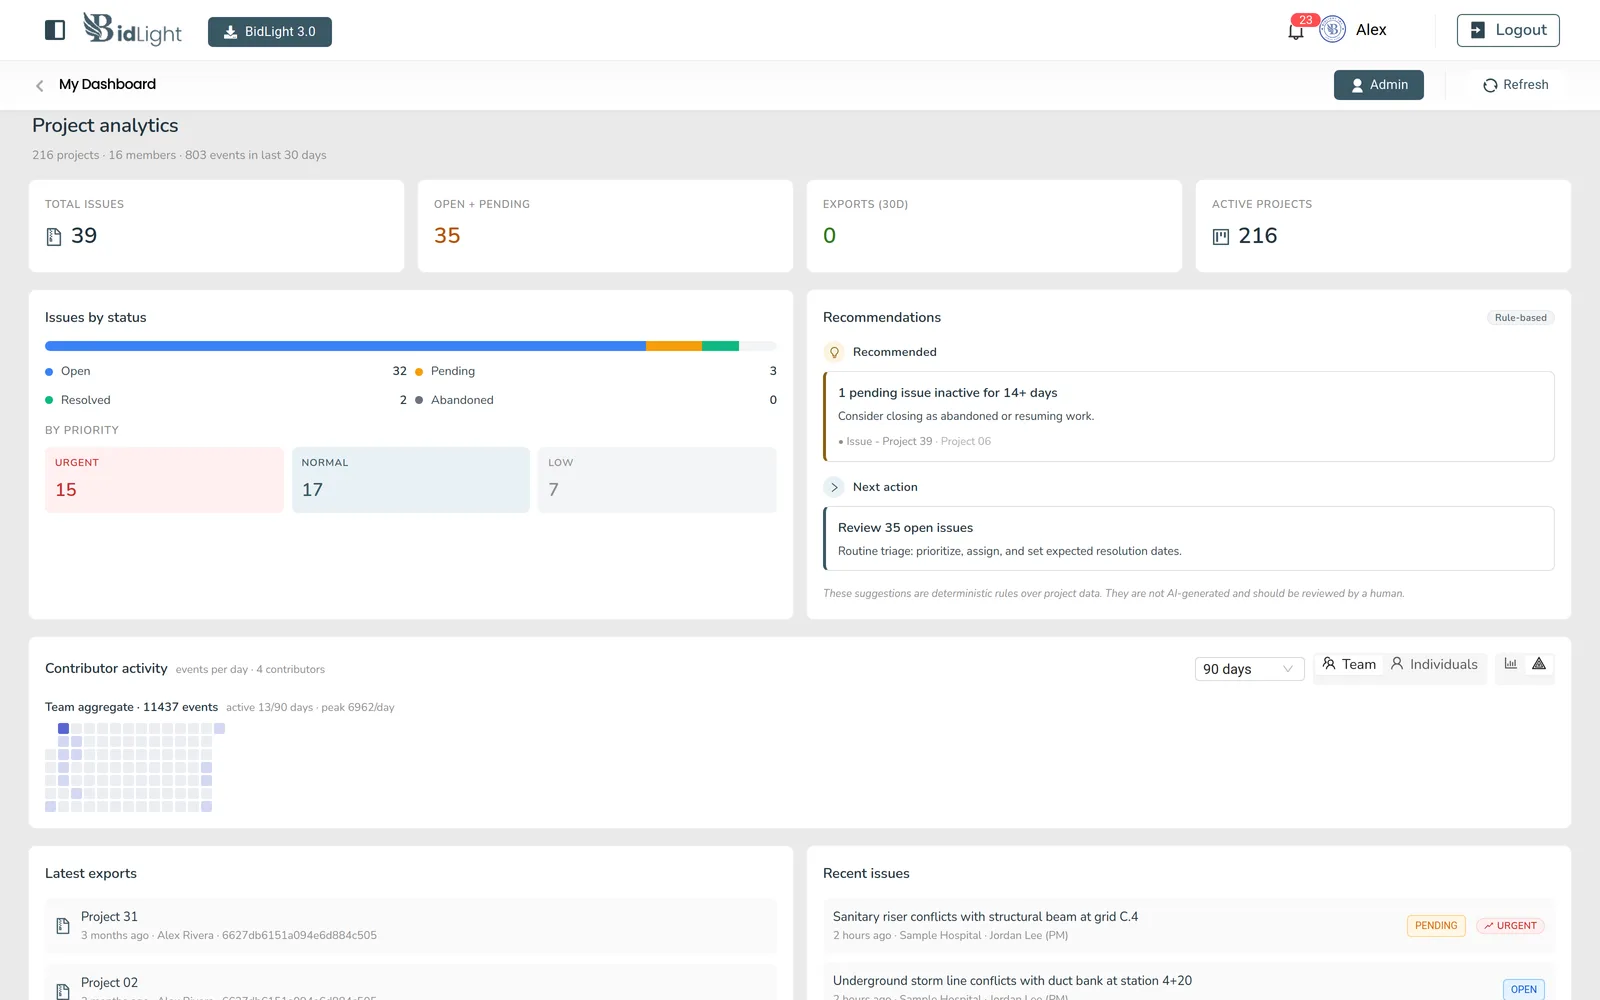
The portfolio view
Issue totals by status and priority, contributor activity over the last ninety days, the most recent exports and the issues raised in the last few hours — for every project at once.
See it against your own model
A demo runs on your project, not ours. Send us a model export and we will walk the same screens with your geometry, your trades and your issues.